Note
Click here to download the full example code
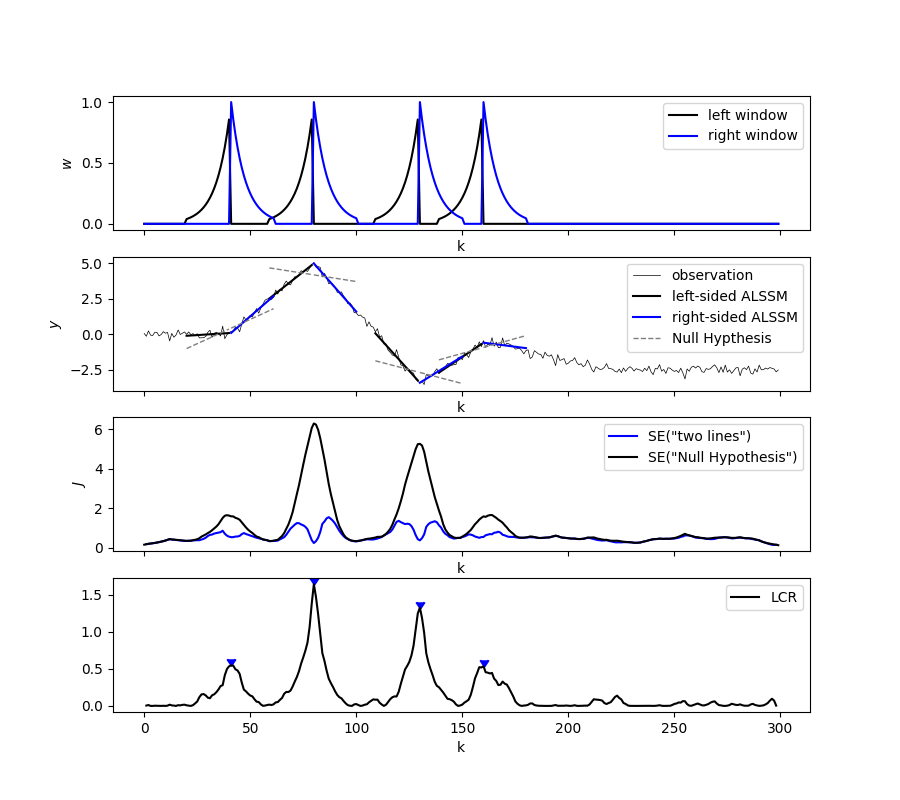
Edge Detection [ex110.0]#
Performs edge detection based on two adjacent ALSSMs, which are connected with linear constraints on its state parameters. Edges are detected on LCR (Log-Cost Ratios) peaks.
Out:
---- MODEL ----
CompositeCost(label=n/a)
  └- ['AlssmPoly(A=[[1,1],[0,1]], C=[1,0], label=alssm_left)', 'AlssmPoly(A=[[1,1],[0,1]], C=[1,0], label=alssm_right)'],
  └- ['Segment(a=-21, b=-1, direction=fw, g=7, delta=0, label=n/a)', 'Segment(a=0, b=20, direction=bw, g=7, delta=0, label=n/a)']
---- ESTIMATES ----
Indices of slope changes (reference):  [40, 80, 130, 160, 220]
Indices of slope changes (estimates):  [ 41  80 130 160]
import numpy as np
import matplotlib.pyplot as plt
from scipy.signal import find_peaks

import lmlib as lm
from lmlib.utils.generator import gen_slopes, gen_wgn

# Signal
K = 300
k = range(K)
ks = [40, 80, 130, 160, 220]
deltas = [0, 5, -8.5, 3, -2]
y = gen_slopes(K, ks, deltas) + gen_wgn(K, sigma=0.2, seed=3141)


# Model
alssm_left = lm.AlssmPoly(poly_degree=1, label='alssm_left')
alssm_right = lm.AlssmPoly(poly_degree=1, label='alssm_right')
segment_left = lm.Segment(a=-21, b=-1, direction=lm.FORWARD, g=7)
segment_right = lm.Segment(a=0, b=20, direction=lm.BACKWARD, g=7)
F = [[1, 0], [0, 1]]
ccost = lm.CompositeCost((alssm_left, alssm_right), (segment_left, segment_right), F)
print('---- MODEL ----')
print(ccost)

H_line = H_Straight = np.array(
                  [[1, 0],  # x_A,left : offset of left line
                   [0, 1],  # x_B,left : slope of left line
                   [1, 0],  # x_A,right : offset of right line
                   [0, 1]])  # x_B,right : slope of right line
H_edge = H_Continuous = np.array(
                  [[1, 0, 0],  # x_A,left : offset of left line
                   [0, 1, 0],  # x_B,left : slope of left line
                   [1, 0, 0],  # x_A,right : offset of right line
                   [0, 0, 1]])  # x_B,right : slope of right line


# Filter
separam = lm.RLSAlssm(ccost)
separam.filter(y)
x_hat_edge = separam.minimize_x(H_edge)
x_hat_line = separam.minimize_x(H_line)

# Signal Approximation
y_hat = ccost.eval_alssm_output(x_hat_edge, alssm_weights=[0, 1])

# Square Error and lcr
error_edge = separam.eval_errors(x_hat_edge)
error_line = separam.eval_errors(x_hat_line)
lcr = -1 / 2 * np.log(np.divide(error_edge, error_line))

# Find best matches
peaks, _ = find_peaks(lcr, height=0.2, distance=20)
print('---- ESTIMATES ----')
print('Indices of slope changes (reference): ', ks)
print('Indices of slope changes (estimates): ', peaks)

# Trajectories
trajs_edge = lm.map_trajectories(ccost.trajectories(x_hat_edge[peaks], thd=0.01), peaks, K, merge_ks=True, merge_seg=False)
trajs_line = lm.map_trajectories(ccost.trajectories(x_hat_line[peaks], thd=0.01), peaks, K, merge_ks=True)

# Windows
wins = lm.map_windows(ccost.windows(segment_indices=[0, 1]), peaks, K, merge_ks=True, fill_value=0)

# Plot
_, axs = plt.subplots(4, 1, sharex='all', figsize=(9, 8))

axs[0].plot(k, wins[0], c='k', ls='-', label='left window')
axs[0].plot(k, wins[1], c='b', ls='-', label='right window')
axs[0].set(xlabel='k', ylabel=r'$w$')
axs[0].legend(loc=1)

axs[1].plot(k, y, lw=0.5, c='k', label='observation')
axs[1].plot(k, trajs_edge[0], lw=1.5, c='k', label='left-sided ALSSM')
axs[1].plot(k, trajs_edge[1], lw=1.5, c='b', label='right-sided ALSSM')
axs[1].plot(k, trajs_line[0], '--',  lw=1, c='tab:gray', label='Null Hypthesis')
axs[1].plot(k, trajs_line[1], '--', lw=1, c='tab:gray')
axs[1].set(xlabel='k', ylabel=r'$y$')
axs[1].legend(loc=1)

axs[2].plot(k, error_edge, c='b', label='SE("two lines")')
axs[2].plot(k, error_line, c='k', label='SE("Null Hypothesis")')
axs[2].set(xlabel='k', ylabel=r'$J$')
axs[2].legend(loc=1)

axs[3].plot(k, lcr, c='k', label='LCR')
axs[3].scatter(peaks, lcr[peaks], marker=7, c='b')
axs[3].set(xlabel='k')
axs[3].legend(loc=1)

plt.show()
Total running time of the script: ( 0 minutes 0.155 seconds)